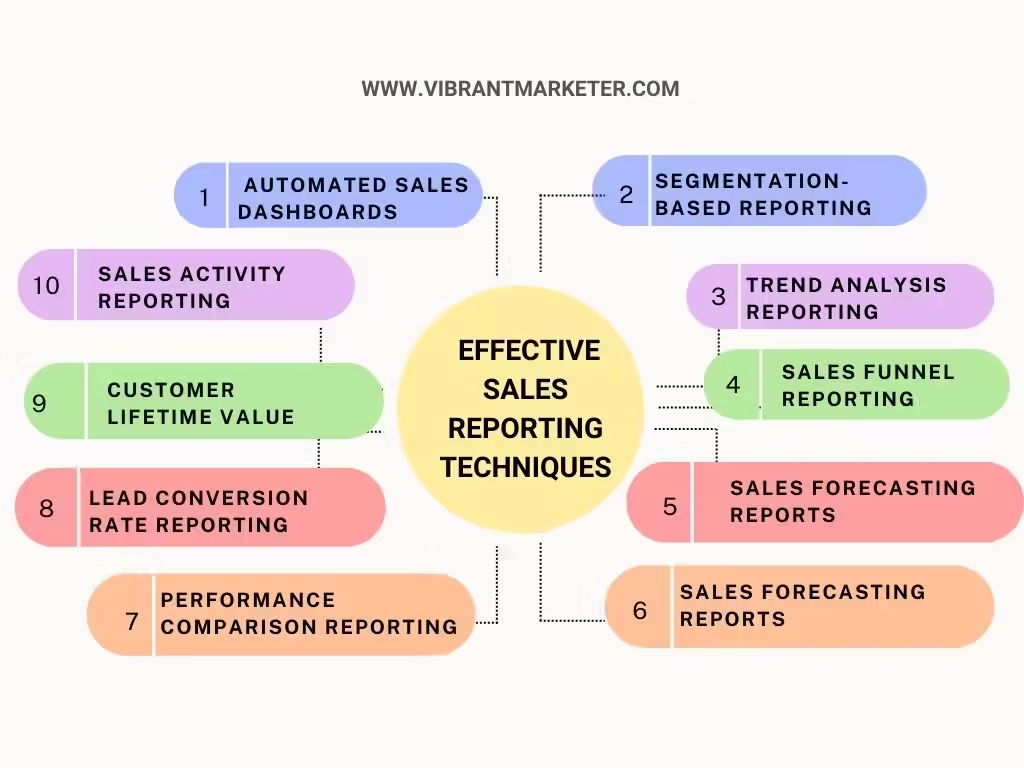
10 Effective Sales Reporting Techniques


1. Automated Sales Dashboards
What it is:
Automated sales dashboards provide a real-time, visual representation of sales metrics such as revenue, lead conversions, sales growth, and more.
Why it’s important:
These dashboards save time by automatically gathering and presenting data, making it easier to track performance, identify areas for improvement, and quickly respond to changes.
How to do it:
- Use tools like Salesforce, HubSpot, or Tableau to create dashboards.
- Identify key metrics to display, such as sales growth rate, customer acquisition cost (CAC), and sales targets.
- Ensure data updates in real-time to maintain accuracy.
Example:
A software company uses a sales dashboard to monitor lead conversion rates, helping the sales team adjust their approach and meet targets faster.
Tip:
Customize your dashboard based on specific business goals and individual team needs for maximum efficiency.
Case Study:
XYZ Solutions implemented a real-time sales dashboard, reducing manual reporting by 60% and enabling a 20% increase in team productivity.
2. Segmentation-Based Reporting
What it is:
This technique involves breaking down sales data by different customer segments, such as industry, location, or purchase behavior.
Why it’s important:
Segmented reports help identify which customer groups are driving sales, allowing teams to focus efforts where they are most impactful.
How to do it:
- Use CRM data to segment customers by demographic, psychographic, and behavioral factors.
- Analyze performance metrics for each segment, such as average order value or customer retention rate.
- Create strategies tailored to high-performing segments.
Example:
A retail chain uses segmentation-based reports to offer targeted promotions for loyal customers, increasing repeat purchases.
Tip:
Regularly update segmentation criteria to reflect changing customer behavior.
Case Study:
A B2B firm analyzed sales by industry segment and found that healthcare clients had the highest growth potential, leading to a 30% boost in targeted sales.
Expert Interview:
“Segmenting sales data allows teams to focus on their best customers and replicate success across other segments.” – Aaron Ross, Author of Predictable Revenue
3. Trend Analysis Reporting
What it is:
Trend analysis identifies patterns and changes in sales data over time, providing insights into market shifts, seasonal demand, or product performance.
Why it’s important:
Understanding the trends helps businesses to anticipate the changes, adjust strategies proactively, and maintain a competitive edge.
How to do it:
- Collect historical sales data from CRM and analyze it over weekly, monthly, or yearly intervals.
- Use graphs or charts to visualize trends.
- Compare past sales data with current performance to spot deviations.
Example:
A toy manufacturer analyzes sales data from the past five years to predict high demand during the holiday season.
Tip:
Include external factors such as market conditions or competitor actions for more accurate insights.
Case Study:
A clothing retailer saw a dip in winter sales and adjusted their marketing campaigns accordingly, increasing off-season sales by 25%.
Expert Interview:
“Recognizing trends empowers sales leaders to move from reactive to proactive strategies.” – Mary Shea, VP at Outreach
4. Sales Funnel Reporting
What it is:
Sales funnel reports track customer movement through different stages, such as lead generation, qualification, and conversion.
Why it’s important:
This technique identifies where prospects drop off in the funnel, highlighting areas that need improvement.
How to do it:
- Break down the sales process into defined stages.
- Monitor key conversion rates at each stage.
- Adjust sales tactics to reduce drop-offs and improve progression.
Example:
A SaaS company tracks its funnel from free trials to paid subscriptions, identifying which features retain customers.
Tip:
Visualize the funnel using graphs to make drop-offs easier to spot.
Case Study:
An insurance firm improved policy sales by 15% after addressing drop-offs during the proposal stage.
5. Sales Forecasting Reports
What it is:
Forecasting uses past sales data, market trends, and other variables to predict future sales performance.
Why it’s important:
Accurate forecasting helps businesses allocate resources, set realistic targets, and make strategic decisions.
How to do it:
- Analyze historical data using tools like regression analysis.
- Factor in market conditions, customer behavior, and economic trends.
- Create short-term and long-term sales predictions.
Example:
An automotive dealership uses forecasting to predict sales for new car models, helping with inventory management.
Tip:
Regularly revise forecasts based on updated data and unexpected changes.
Case Study:
A tech startup achieved better inventory control by using predictive forecasting, leading to a 20% reduction in costs.
Expert Interview:
“Forecasting gives businesses a clearer picture of what’s ahead, allowing them to act with confidence.” – SaaS Expert Tomasz Tunguz, Venture Capitalist
6. KPI-Based Reporting
What it is:
Key Performance Indicator (KPI) reporting tracks metrics aligned with business goals, such as revenue growth, lead conversions, and customer acquisition cost.
Why it’s important:
KPIs keep sales teams focused on achieving targets, offering clear metrics for measuring success.
How to do it:
- Define KPIs based on business objectives.
- Use tools like CRM systems to measure and track KPIs in real-time.
- Regularly review and adjust KPIs as needed.
Example:
A sales team tracks KPIs like average deal size and lead conversion rate to measure success.
Tip:
Set specific, measurable, achievable, relevant, and time-bound (SMART) KPIs.
Case Study:
An e-commerce company doubled its sales growth rate by focusing on key KPIs such as cart abandonment and customer lifetime value.
Expert Interview:
“Tracking the right KPIs ensures every action aligns with the big picture.” – David Skok, VC at Matrix Partners
7. Performance Comparison Reporting
What it is:
Performance comparison reporting involves comparing current sales performance with past periods, industry benchmarks, or competitor data to assess success.
Why it’s important:
This technique provides context, helping businesses understand whether they are on track or falling behind. Comparing performance with benchmarks or competitors allows you to identify areas of strength and weakness.
How to do it:
- Use historical data to compare sales from the current period with the same period last year or previous quarters.
- Compare your sales performance with competitors or industry averages to gauge your position in the market.
- Highlight areas of improvement or underperformance and set corrective measures.
Example:
A restaurant chain compares its sales growth in different locations with the average growth in the industry to identify high-performing outlets and replicate their success in underperforming areas.
Tip:
Regularly update performance comparison reports to include new industry data, trends, and competitor activities.
Case Study:
An online retailer improved sales by 18% after comparing their sales data to industry standards and realizing they were underperforming in certain regions.
Expert Interview:
“Comparing your sales to benchmarks helps you spot missed opportunities and improve your market position.” – Brian Halligan, CEO of HubSpot
8. Lead Conversion Rate Reporting
What it is:
Lead conversion rate reporting tracks the percentage of leads that turn into actual sales, providing insights into the effectiveness of sales strategies.
Why it’s important:
Understanding lead conversion rates allows businesses to refine their lead qualification process, improve sales strategies, and enhance the overall customer experience, directly impacting revenue growth.
How to do it:
- Track the total number of leads generated and the number of leads that convert into sales.
- Measure conversion rates for different sales channels or marketing campaigns.
- Adjust your approach by focusing on high-converting lead sources and optimizing weaker areas.
Example:
A digital marketing agency tracks its lead conversion rates across different campaigns, discovering that email marketing generates higher-quality leads than social media, allowing them to focus more on email outreach.
Tip:
You can use lead scoring models to better identify which leads are most likely to convert and you should prioritize them accordingly.
Case Study:
A SaaS company increased its lead conversion rate by 25% by improving its lead nurturing process, segmenting leads based on behavior, and providing tailored content.
9. Customer Lifetime Value (CLV) Reporting
What it is:
CLV reporting tracks the total revenue a customer will generate for your business over their lifetime as a paying customer. It helps assess the long-term value of acquiring new customers.
Why it’s important:
Focusing on CLV ensures that sales teams are not just acquiring customers but are nurturing long-term relationships that provide consistent revenue, which is more profitable than chasing short-term sales.
How to do it:
- Calculate the average purchase value, frequency, and customer lifespan to estimate CLV.
- Use CRM tools to track customer interactions and adjust strategies based on their value over time.
- Compare CLV across different customer segments to identify the most profitable groups.
Example:
An e-commerce business finds that customers who sign up for their loyalty program have a 40% higher CLV, so they refocus marketing efforts to encourage more sign-ups.
Tip:
You should regularly update your CLV calculations to ensure that they can reflect the current customer behavior and the current market trends.
Case Study:
An online subscription service improved retention and boosted CLV by 30% by offering personalized discounts and exclusive content to high-value customers.
10. Sales Activity Reporting
What it is:
Sales activity reporting involves tracking the daily, weekly, or monthly activities of sales teams, such as calls made, meetings held, and emails sent. It helps understand the efforts behind achieving sales results.
Why it’s important:
Sales activity reports help identify which activities are leading to successful sales outcomes. This insight allows managers to focus on high-impact activities and ensure that sales efforts are aligned with overall business goals.
How to do it:
- Track all sales activities through CRM systems, including phone calls, emails, meetings, and demos.
- Analyze the relationship between activity volume and sales outcomes to understand which activities are most effective.
- Provide regular feedback and training to sales teams based on activity data.
Example:
A real estate company tracks how many cold calls agents make each day and correlates the data with the number of successful deals closed, discovering that personalized follow-up calls lead to a 30% higher success rate.
Tip:
Encourage your sales team to log every activity and review the data weekly to spot patterns and improve performance.
Case Study:
A B2B software company increased sales by 22% after reviewing sales activity reports and finding that fewer demo calls were converting into deals, prompting them to refine their demo process.
Expert Interview:
“Sales activity reports provide the data needed to coach your team effectively and improve performance.” – Tiffani Bova, Global Growth and Innovation Evangelist at Salesforce
Conclusion: Effective Sales Reporting Techniques
Understanding the impact of lead conversion rates, CLV, and sales activities enables companies to refine their processes and focus on what works best.
By continuously evaluating and adjusting these reporting techniques, sales teams can improve their performance and achieve long-term success.
FAQs
Sales reporting is the process of tracking, analyzing, and presenting sales data to evaluate performance and make informed business decisions.
Sales reporting helps businesses monitor progress, identify trends, assess sales performance, and make data-driven decisions to improve strategies and outcomes.
CRM systems like Salesforce, HubSpot, and Zoho, as well as data visualization tools like Tableau or Google Data Studio, are commonly used for creating sales reports.
Sales data can be segmented by geography, product, customer type, sales rep, or time period to gain deeper insights into specific areas of performance.
A sales dashboard is a visual representation of sales metrics that allows businesses to track performance in real-time, often with graphs and charts for easy interpretation.
Trend analysis helps identify patterns over time, such as seasonal fluctuations or long-term growth, enabling businesses to adjust their strategies accordingly.
Comparing current performance with past data or industry benchmarks helps businesses identify strengths, weaknesses, and areas for improvement.
Share this post


Chiranjeev Jaiswal
Chiranjeev Jaiswal (M.B.A. and P.G.D.M.in Marketing from IM-BHU) launched "Vibrant Marketer" out of a deep passion for all things marketing. After years of working in the industry, he realized that marketing success isn’t about following the same playbook—it’s about staying ahead of the curve and thinking outside the box.


